The Dashboards provide a variety of icons and options that permit the user to navigate, filter, export and display the information contained in the Office/Patient database. Only the applicable icons will be displayed base on the action a user has completed.
IMPORTANT
Depending on the speed of your server and volume of data that must be analyzed it may take a several minutes to compile the data before it is displayed. During the analysis and displaying, users will see a Loading message indicating that the requested information is being gathered and analyzed for each level of the drill-down available. The first time you open Eye on Your Business you may see a 30 second delay (blank screen) while it prepares the data for initial usage.
|
EXPORT
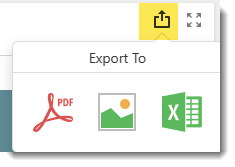
The Export Icon permits a user to export the selected item to a PDF, Image or Excel Spreadsheet for further analysis.
MAXIMIZE
The Maximize Icon will expand the selected item to full screen. The icon will change color to RED allowing the user to return to the previous screen size.

![]()
RETURN
The return Icon appears when a Drill down action has be selected. It will return the user to the previous drill down level.
![]()
SCROLL
Some grids can be scrolled to view additional data.. The scroll bar is a light Grey color and appears when the cursor is located at the bottom of the grid.

ARROWS
The various arrows, displays the change that has occurred between two periods.
▪The Green up Arrow represents an increase.
▪The Red down arrow represents a decrease.
▪The Orange Arrow on a green background represent a positive trend for the item
▪The Orange Arrow on a red background represent a negative trend for the item


FILTERS
When selecting a Filter Option, the filter icon is displayed. To remove the filter, click on the filter (X) to remove the filter. Some displays allow the user to filter the data for specific drill down levels. Multiple Filters can be applied at the same time.
![]()

ORDERING
Columns can be ordered in Accending or Decending order


DRILL DOWN
By clicking on dashboard item will drill down (if available) to more granular details for the selected item. The Loading message will appear to indicate that it is processing the requested data.
Important
Offices with a single location filtering and drill down capabilities of a dashboard will be limited to the one office..
Multi-offices can drill down to view each office details and providers associated with the office. A provider can be associated with more than one office.
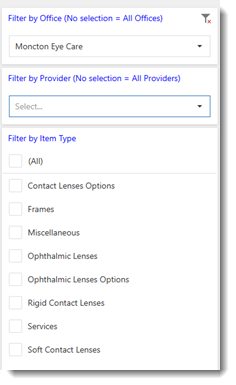
In the example to the right, the user can select the office then further filter the information by the selected office providers. Multiple filters can be applied at the same time.
Single office have the same capabilities as the multi-office but are limited to the single office location.
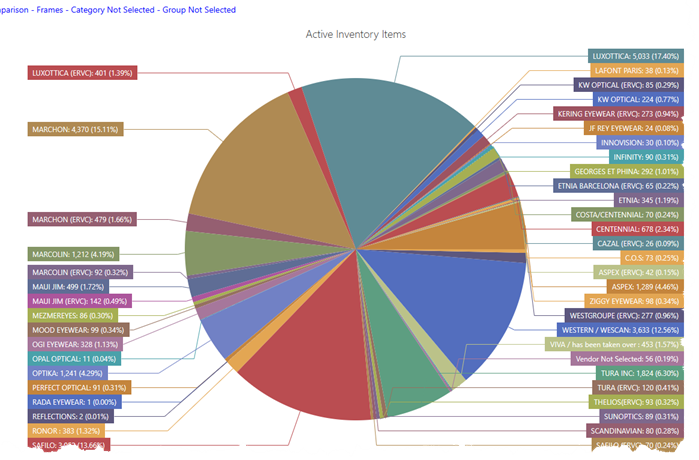
Non-Classified items will display a blank screen but will not limit the drill down levels available. For example, if your inventory does not use categories or grouping of inventory items, these analysis levels will be blank. However the user can click on the non-classified level (see "Category Not Selected" image to the right) level to continue to a lower level such as the vendor or manufacturer.
Charts may also provide drill down capabilities, providing further breakdown of the information originally displayed by the chart..
|
|
The example below show 4 levels of drill down capabilities for one selected dashboard.. Drill down option does not exist on all items and when available can vary from 1-4 (normal) up to 7 levels (Inventory value tracking)..
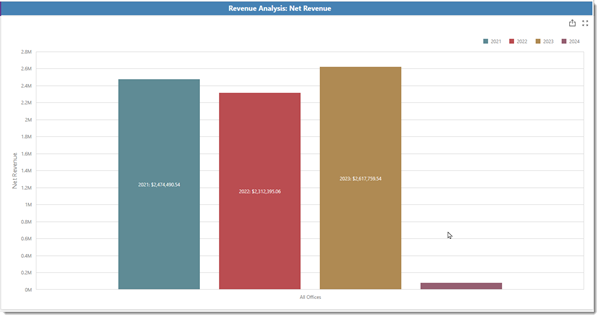
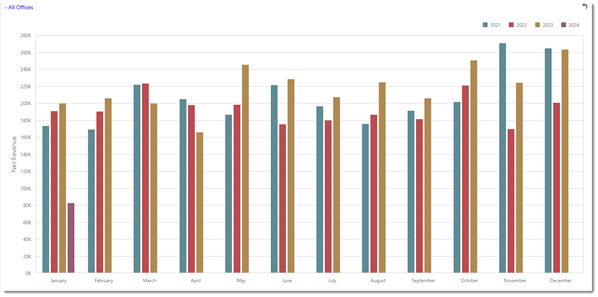
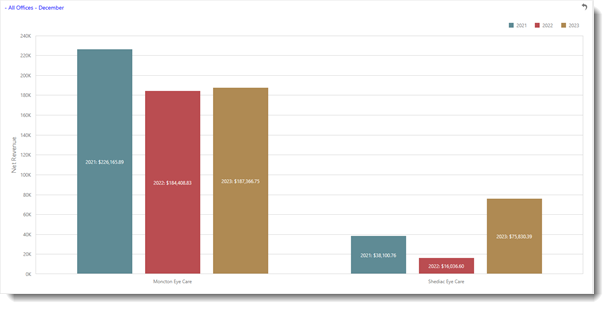
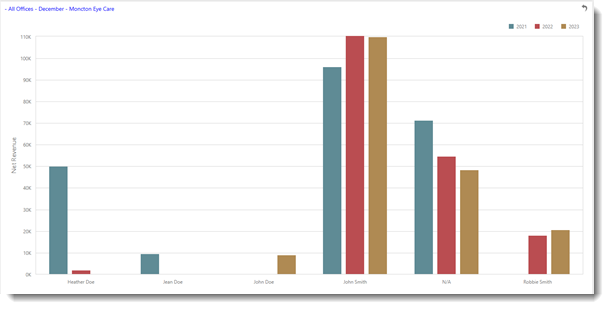
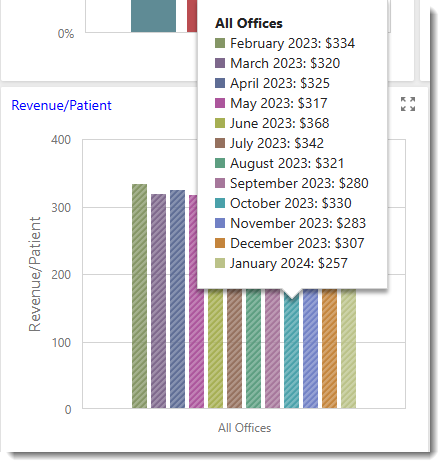
Hovering the mouse over a graph, displays the legend associated with the graph
